Table 1: The first 25 lines of synthetic data, including lake chlorophyll-a data and local climate. The are 352 lines, as 352 samples in total. The format of this file is csv.
Table 2: The modified data used for Nonmetric multidimensional scaling (NMDS). Some columns which are not related to this study were removed to simplify the steps. Only 25 rows are shown here, but the original data has 352 rows. (Table 8,9)
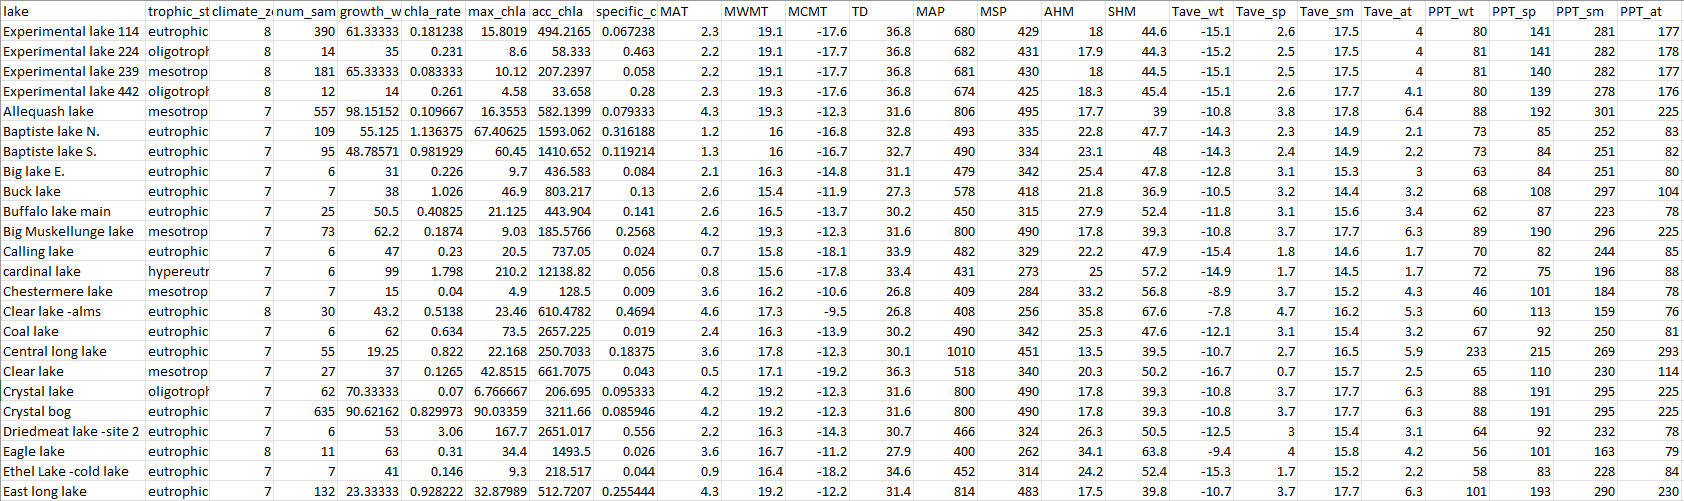
Table 3: The modified data for the growth of chlorophyll-a and climate factors at Windermere - north basin, United Kingdom, from 1064 to 2009. Only 25 rows are shown here, but the original data has 46 rows. (Table 10, 11)

Table 4: The trophic state index (TSI) and the trophic state
Trophic state |
Trophic state index (TSI) |
Oligotrophic |
<30 |
Mesotrophic |
30-50 |
Eutrophic |
50-60 |
Hypeeutrophic |
>60 |
Table 5: The variables and description for index coverred in this paper
Variable |
Description |
growth_window_length |
duration of the growth period (day) |
chla_rate |
rate of increase in chlorophyll-a concentration during the growth period (µg/L/day) |
max_chla |
maximum chlorophyll-a concentration reached during the growth period (µg/L) |
acc_chla |
accumulated chlorophyll-a (µg/L) |
MAT |
mean annual temperature (°C) |
MWMT |
mean warmest month temperature (°C) |
MCMT |
mean coldest month temperature (°C) |
TD |
temperature difference between MWMT and MCMT, or continentality (°C) |
MAP |
mean annual precipitation (mm) |
MSP |
May to September precipitation (mm), |
AHM |
annual heat-moisture index (MAT+10)/(MAP/1000)) |
SHM |
summer heat-moisture index ((MWMT)/(MSP/1000)) |
Tave_sp |
spring mean temperature (°C) |
Tave_sm |
summer mean temperature (°C) |
Tave_at |
autumn mean temperature (°C) |
Tave_wt |
winter mean temperature (°C) |
PPT_sp |
spring precipitation (mm) |
PPT_sm |
summer precipitation (mm) |
PPT_at |
autumn precipitation (mm) |
PPT_wt |
winter precipitation (mm) |
