The Figure 6 and Figure 7 below show the relationship between seasonal mean temperature, mean annual precipitation and chlorophyll-a growth rate. The trendlines was represented by two regions, North America, and Europe. The trendlines in Figure 6 (a,b,c,d), show that with the increased precipitation, the chlorophyll-a growth rates at both region, North America and Europe have declined trends. Also, the color from low to high chlorophyll-a growth rate (y-axis, low to high), changes from blue to red. This means that the algae at higher trophic state index (tsi) have faster growth rate. Trendlines for average mean temperature in Figure 7 (a, b, c, d) show the chlorophyll-a growth rates decline with the increased seasonal temperature in North America. But in Europe, it's in the opposite, the chlorophyll-a growth rates increase with the increased seasonal temperature in all four graphs in Figure 7 (a, b, c, d). The colors in Figure 7 also indicate that the algae at higher trophic state index (tsi) have faster growth rate in both regions.
The main cause of this is that the less precipitation also results in less flow in the lake. Slow-moving water can also be more suitable for the growth of algae (EPA United States Environmental Protection Agency 2022). And the Northern North America has relatively lower average temperature than the Northern Europe. We can also see more triangles (representing North America) on the relative left of in Figure 7 (a, c, d), where cooler temperatures occur during spring, autumn, and winter. However, the average temperature during summer is close in two regions. So the algae species in North America need to experience longer colder days each year. This may make algae species in North America likely better adapted to low temperatures than algae species in Europe.
The main cause of this is that the less precipitation also results in less flow in the lake. Slow-moving water can also be more suitable for the growth of algae (EPA United States Environmental Protection Agency 2022). And the Northern North America has relatively lower average temperature than the Northern Europe. We can also see more triangles (representing North America) on the relative left of in Figure 7 (a, c, d), where cooler temperatures occur during spring, autumn, and winter. However, the average temperature during summer is close in two regions. So the algae species in North America need to experience longer colder days each year. This may make algae species in North America likely better adapted to low temperatures than algae species in Europe.
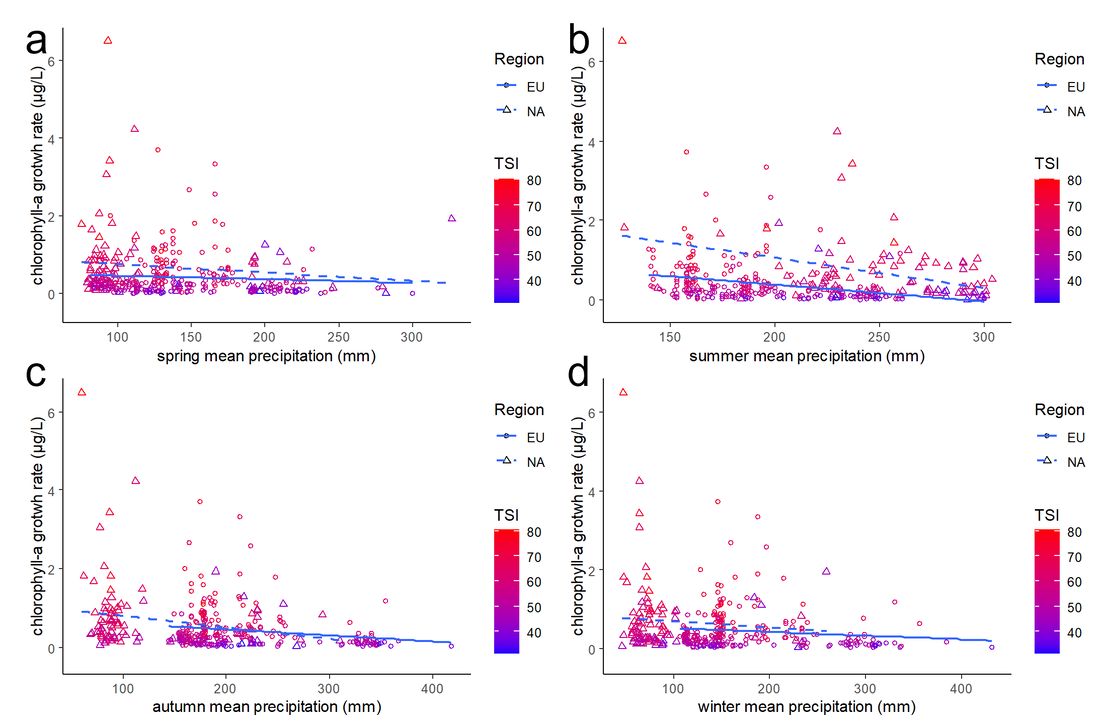
Figure 6: The plots show the relationship between seasonal mean precipitation and chlorophyll-a growth rate during the growth period. There are 352 samples in total for each graph. The trendline is calculated by using linear regression. The color reporesents the trophic states index (tsi), the color blue means low tsi (oligotrophic) and red means high tsi (hypertrophic). The circular and straight trendlines represent North America while the triangle and dashed lines represent Europe. All the trendlines are ploted by using linear regression. (upper left corner: 6.a, upper right corner: 6.b, lower left corner 6.c, lower right corner 6.d)
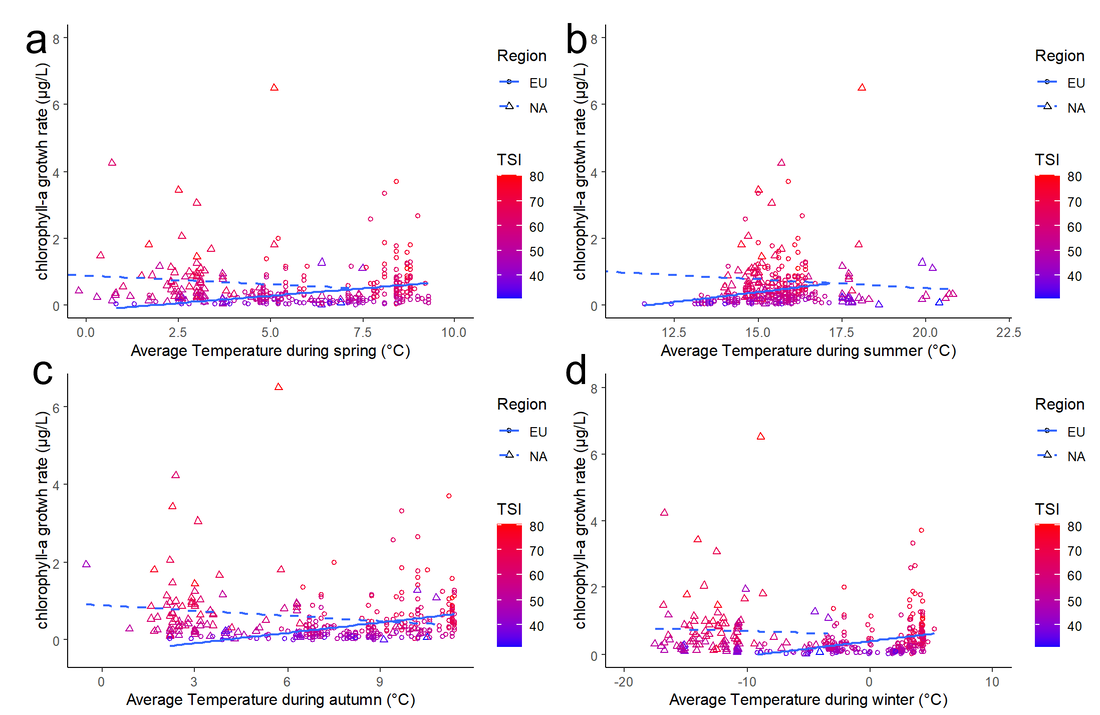
Figure 7: The plots show the relationship between seasonal average temperature and chlorophyll-a growth rate during the growth period. There are 352 samples in total for each graph. The trendline is calculated by using linear regression. The color reporesents the trophic states index (tsi), the color blue means low tsi (oligotrophic) and red means high tsi (hypertrophic). The circular and straight trendlines represent North America while the triangle and dashed lines represent Europe. All the trendlines are ploted by using linear regression. (upper left corner: 7.a, upper right corner: 7.b, lower left corner 7.c, lower right corner 7.d)
R code
Nonmetric multidimensional scaling (NMDS) for climate and chlorophyll-a under different trophic statuses was used to test the group difference which is shown in figure 8. Since the data is not evenly distributed across the four trophic states, the confidence interval is set at 60%. As shown in figure 9, with the available nutrients increase (from oligotrophic to hypereutrophic), it can be seen that the circles tend to rotate from right to left. The arrow indicates the direction and the trends. The oligotrophic is more dependent on precipitation during summer, autumn, spring, and winter, May to September precipitation (MSP), and mean annual precipitation (MAP). Some of these variables are related. This shows that the lakes with oligotrophic status are more dependent on the amount of precipitation. The increased precipitation can increase the water volume, which decreases the water nutrients content which makes it has very low available nutrients. Also, frequent precipitation can increase the water flow which can cause disturbance to algae's growth (EPA United States Environmental Protection Agency 2022). The algal bloom is less common in water sources when it has a high water flow. The disturbance can increase the available oxygen in the aquatic environment, which can reduce anoxic conditions for aquatic organisms that are frequently associated with eutrophication. With the increased nutrient availability, the samples will become more dependent on temperature during spring, summer, autumn and winter, annual heat-moisture index (AHM), and summer heat-moisture index (SHM). The chlorophyll-a concentration (chla_rate), maximum chlorophyll-a concentration reached (max_chla) and accumulated chlorophyll-a during the growth period (acc_chla) also keep increasing with increased trophic states as more available nutrients. And in general, the eutrophic status is the intermediate form as its location is in the middle. This also shows that this state is more susceptible to environmental factors. With decreased precipitation and warmer temperature, it can be transferred to hypereutrophic; with increased precipitation and colder temperature, it can be transferred to meta eutrophic state. By observing the vectors, the chlorophyll-a concentration growth rate (chla_rate) is positively related to Summer Heat-Moisture Index (SHM) and Annual Heat-Moisture Index (AHM), mean temperature during summer, and negatively related to May to September precipitation (MSP) and mean precipitation during summer (MSP and PPT_sm are related). The previous figures provide an explanation for the observed this. As the phenomenon of Arctic amplification, lakes located at high latitude areas will be affected by greater global climate warming (Alaska Nature and Science 2022). The rising average temperature will facilitate nutrient availability in lakes and also provide a warmer growth environment for algae. So that the faster growth rate and accumulation of algae may cause potential risks to lakes, such as Dead Zones and Harmful Algal Blooms.
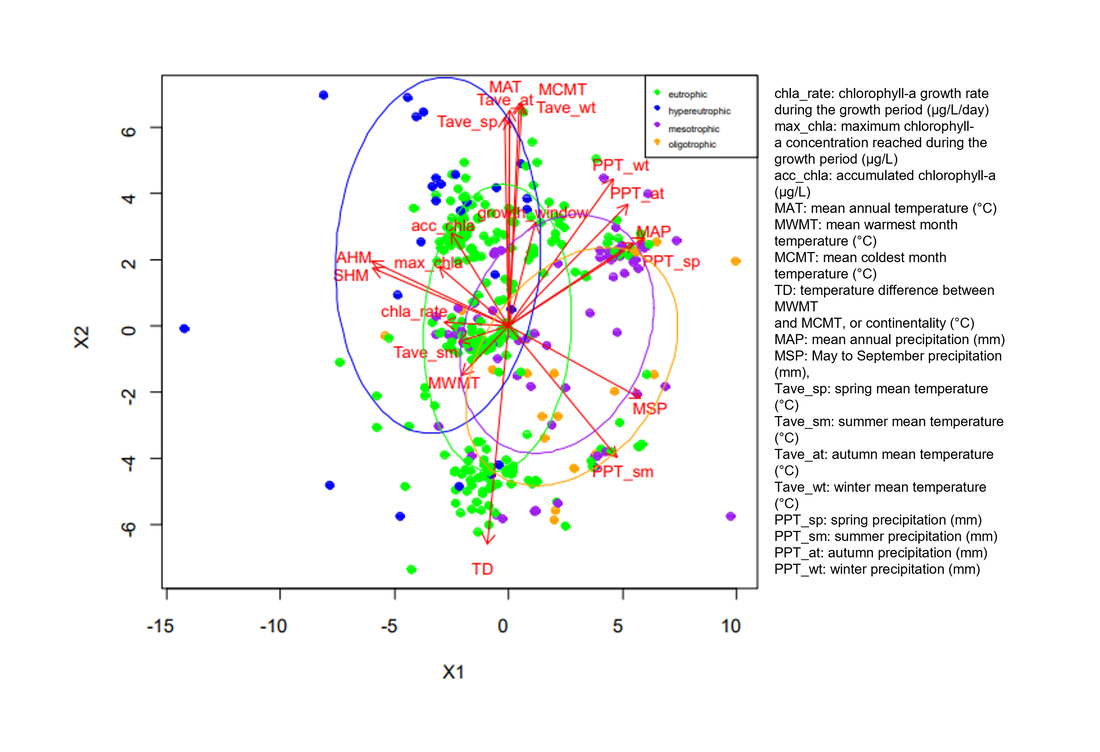
Figure 8. The Nonmetric multidimensional scaling (NMDS) for climate and chalorophyll-a under different trophic status . The level of confidence for the ellipse, which is set to 0.6 (i.e., 60% confidence interval). Vectors indicate the relationships of variables. The color represents different trophic states. There are 352 samples in total. For color: Hypereutrophic (blue), Eutrophic (green), mesotrophic(purple) and Oligotrophic (yellow).
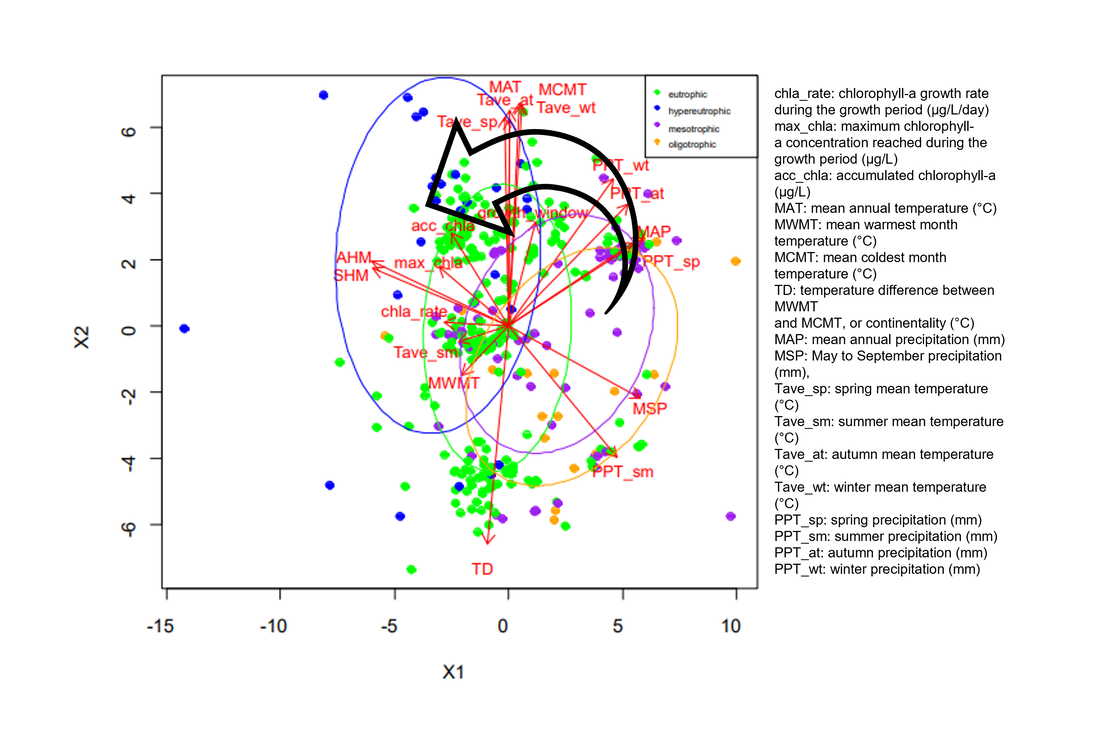
Figure 9. The Nonmetric multidimensional scaling (NMDS) for climate and chalorophyll-a under different trophic status. Arrows indicate the direction in which the ellipse changes with trophic states (increased available nutrient). For color: Hypereutrophic (blue), Eutrophic (green), mesotrophic(purple) and Oligotrophic (yellow).
R script
|
The direct gradient analysis with NMDS for climate as factor shows both predictor and response variables. All the variables were numeric. European samples are represented by triangles and North American samples by circles. Based on the graph, it can be observed that there is a clear difference in the distribution of lake samples between North America and Europe.
The samples in North America are strongly positively affected by the temperature difference between MWMT and MCMT (TD) and mean warmest month temperature (°C) (MWMT). They are also negatively affected by the average temperature during winter, spring and autumn, mean coldest month temperature (MCMT) and mean annual temperature (MAT). This is also consistent with the discussion in Figure 6,which mentioned that algae in North America are more temperature-sensitive. North American algae tend to grow at cooler temperatures than European algae, although extremely low and extremely high temperatures can negatively affect the growth of North American algae. Samples in Europe are mainly divided into three groups. Two groups have a weaker correlation with temperature and correlation with precipitation. And one group has correlation with temperature, but in opposite with the samples in North America. The Map 1 shows that the lake samples in North America are mainly located in the province of Alberta, Canada, with a small portion distributed in the eastern parts of Canada and the United States. The samples in Europe are distributed in Sweden and the United Kingdom, with one sample located in Germany. This suggests that the composition of algae in these European samples may be affected by geographical spans and other potential factors that were not considered, such as human activities and fish species in the lakes. Compared to North American samples, the differences in the distribution and characteristics of the lake samples in Europe may have resulted in varying environmental conditions, leading to different types of algae. This also demonstrates the impact of spatial differences on the growth of algae. The figure also shows that the Summer Heat-Moisture Index (SHM) is strongly positive related to response variables. The Summer Heat-Moisture Index (SHM) is calculated based on the combined impact of temperature and precipitation during the summer season, whereas growth and bloom usually occur in warmer temperatures (EPA United States Environmental Protection Agency 2022). Some algae also release toxins during this period. This can cause the death of other aquatic plants and species’ death. The decomposition of them may increase the nutrient availability such as N, and P in the local water sources. Due to the decreased competition with other plant species, fewer consumers (fishes), and increased available nutrients, the algae have a better growth environment (EPA United States Environmental Protection Agency 2023). Higher SHM means more hot, dry days may occur. Due to the sample lakes being in high latitudes, they have relatively low temperatures. The increased temperature during summer can provide algae warmer, a more suitable environment which can let them grow better. And more drier days mean more water is evaporated. Nutrient concentrations in lower water volume lakes will increase which is more available for algae. Less precipitation also results in less flow in the lake, slow-moving water can also be more suitable for the growth of algae. 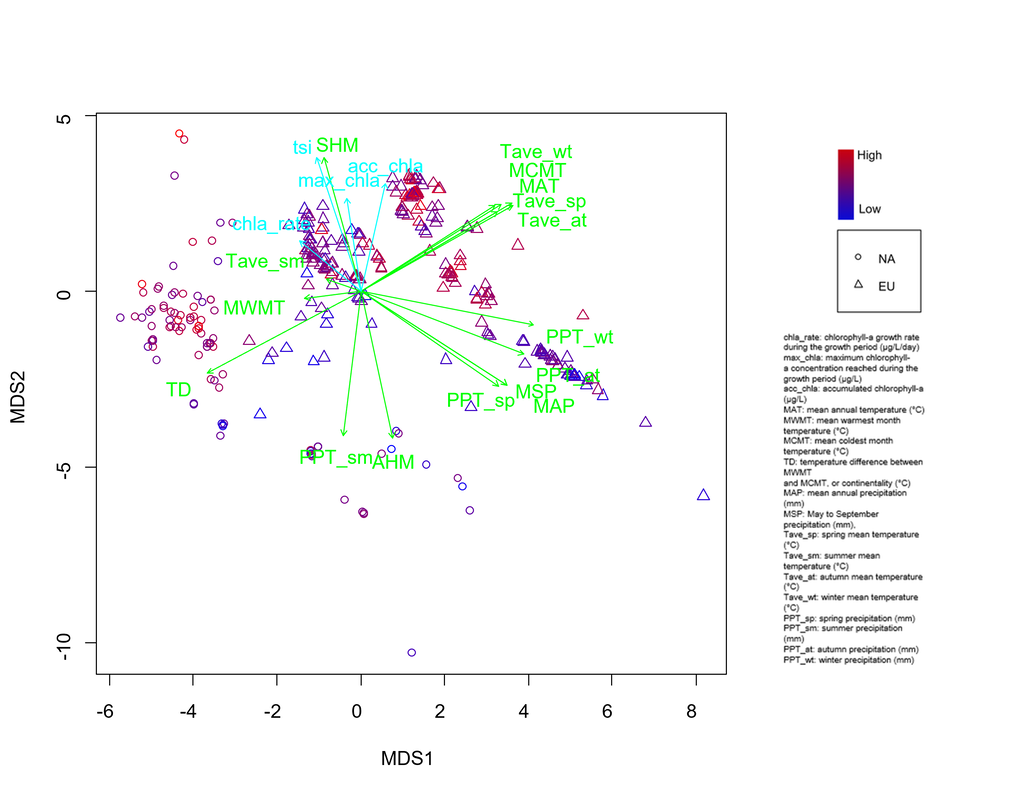
Figure 10: The direct gradient analysis as NMDS for climate as predictor, and chlorophyll-a as response under different trophic status index (tsi). The green arrows represent the predictor variables, and green arrows represent the response variables. The shape indicates the region, and colors indicate the trophic status index at each location.
R code
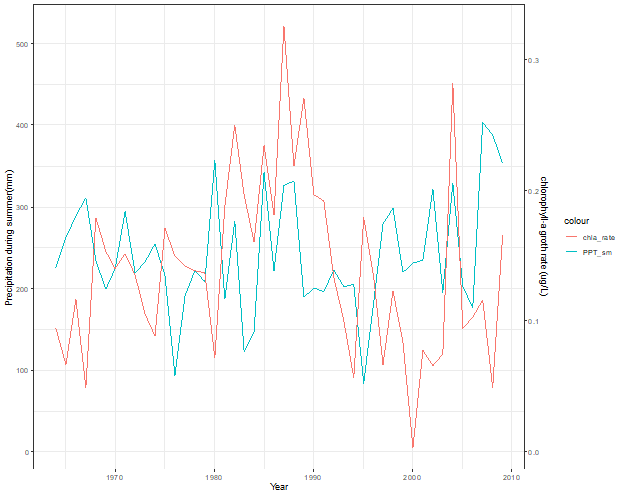
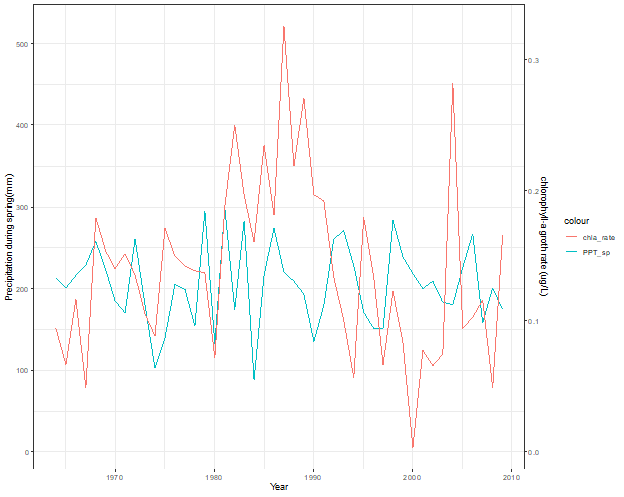
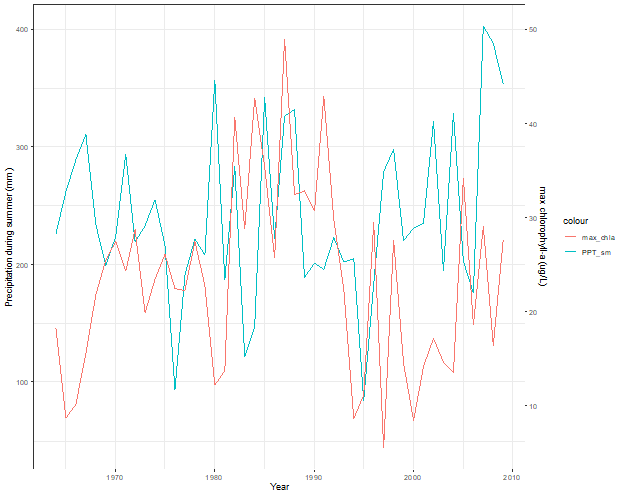
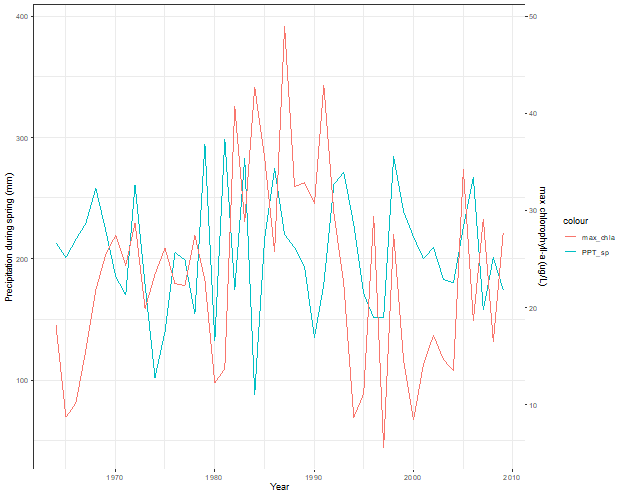
Line figures 10 and 11 show the relationship between summer/spring precipitation and the growth rate/ accumulated of chlorophyll-a during the growth period at Sample Lake Windermere north basin, UK. As talked before, the common growth season for algae is summer. Figure 10. a shows the relationship between precipitation during summer and chlorophyll-a growth rate during the growth period. The years at the left and right sides (Figure 10.a) show that precipitation and chlorophyll-a growth rate decrease with increasing summer precipitation. But intermediate years (around 1990) seem to show a positive correlation between chlorophyll growth rate and summer precipitation. This phenomenon can be explained in figure 10. b, which shows the relationship with precipitation during spring. The precipitation during spring around 1990 has a decreasing trend, but the growth rate of chlorophyll-a has a strongly increased trend. This indicates that the influence of precipitation on the growth rate of chlorophyll is sometimes delayed rather than instantaneous.The same phenomenon is more obvious in Figure 11.a and 11.b. Figure 11.b The opposite trend of the maximum concentration of chlorophyll-a in the growth cycle and precipitation in spring is more obvious than that in summer. This proves that seasonal climates such as precipitation may have delayed effects on algae growth. But if extreme weather, such as a sudden surge in precipitation, causes floods, it will have an instantaneous negative impact on algae. The delayed effect also applies to the effects of global warming on lake ecosystems.
|
|
|
Figure 10: The liner chats for precipitation during summer and spring with chlorophyll-a growth rate from 1964 to 2009 at Windermere north basin, UK. (Left, 10.a, Right 10.b)
|
|
Figure 11: The liner charts for precipitation during summer and spring with accumulated chlorophyll-a concentration from 1964 to 2009 at Windermere north basin, UK. (Left, 11.a, Right 11.b)
R script
